To address the challenge of managing high-demand areas (for bike taxi) like shopping districts and tech parks, where a constant supply of bike taxi drivers was essential, Rapido’s Operations team initially assigned drivers manually through calls and managing the data on spreadsheets. This offline approach was difficult to scale, track, and optimize. In response, a solution was developed to automate the assignment process, reducing dependency on the Ops team and improving operational efficiency. Over a year, the in app feature was continuously improved through experimentation, leading to better business outcomes and a significant case study for enhancing the Rapido driver app experience.
YEAR
2022- 2024
ROLE
UI Design
UX Design
User Research
TEAM
2+ Backend and Frontend Developers
2 Marketplace Product Managers
1 Designer
Introduction
In 2022 the process of assigning drivers to high-demand zones was manual and relied heavily on offline methods managed by the Operations team of Rapido.
The Ops team maintained a spreadsheet with drivers interested in working inside fixed zones.
They called each driver to provide them details and get their confirmation for assignments.
Drivers only received orders within their assigned zone and had to stay within it to continue receiving requests.
Gathering context
I was called in at this stage to evaluate the experience for both drivers and the Operations team. The existing system was a bit of a puzzle, even to our product team. To clear the fog, I contacted regional managers, learning the ins and outs of how zones worked and what issues they faced. Sharing these insights with the product team was like adding missing pieces to our collective puzzle.
I uncovered several key UX and operational gaps:
Drivers had no visibility of zones in the app and depended entirely on the Ops team for guidance.
The Ops team handled numerous calls from drivers, many of whom wanted out.
There was no reliable system to track assignments, manage data, or measure performance.
Mapping the User Journey with Ops team
I took the initiative to map the journey with the Ops team members, and incorporated their inputs to make the journey better.

Identifying triggers
I collaborated with the PMs and RMs to identify the right triggers for our drivers using the 'Hooked' method.

Key Decisions and MVP
A collaborative journey mapping with the Ops team and PMs helped us visualise the ideal user journey and identify key needs for drivers and Ops.
Key decisions:
Discussions with the stakeholders pointed towards solving the primary issues for drivers: in-app navigation, real-time alerts, and basic education about the feature.
Leverage existing in-app navigation features to minimize development efforts and enable quicker implementation.
Solving for driver's fundamental needs may reduce complaint calls and lift some burden from the Ops team.
This MVP will serve as a starting point to build and expand upon the overall driver experience post its implementation and gaining confidence on it's impact on business.
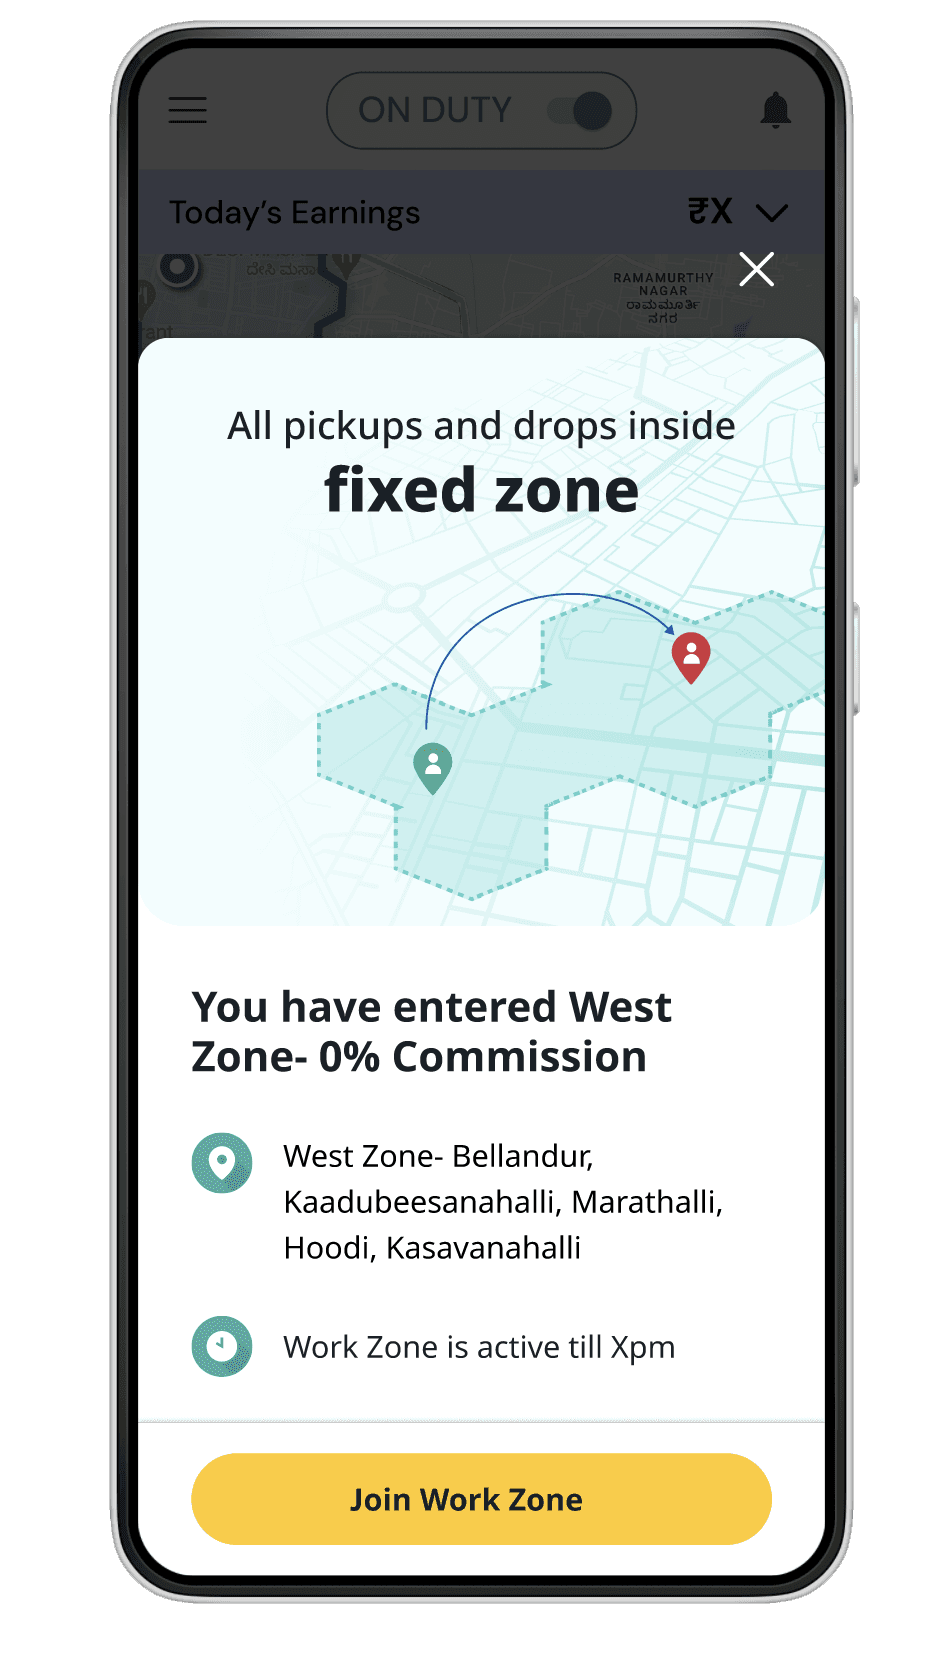
MVP Released in 2023
Data insights on the MVP
Quantitative insights:
Data showed that drivers working in these zones were thriving. They weren't just earning more; we saw a healthy conversion from gross bookings to completed net rides.
In Delhi, a single zone in Ghaziabad was responsible for a quarter of all bike taxi orders. The impact is even more pronounced in Kolkata, where one zone generates over half of the city's orders. Other cities like Hyderabad are showing similar trends, with a single zone accounting for over a third of all orders.
Qualitative insights:
I chatted directly with drivers assigned to zones, uncovering their challenges firsthand:
It was noticed that the drivers were moving towards the zones which were displayed as disabled on the map. This suggested that we need to hide the zones when they are not active.
Most drivers in Delhi who were delivery drivers part time were aware about the concept of "Zones", since a similar product existed in Swiggy and Zomato.
Education and awareness regarding zones was poor amongst drivers who had not received calls from the Ops team asking them to join.
What didn't work
Once the MVP was launched, we took 50+ interviews with bike taxi drivers to gain their insights:
There is very poor awareness and understanding among driver base about what work zone is .
Getting captains to understand Work Zones via in-app journey is an uphill battle. They don't have the time to go through and comprehend everything during work hours and are interrupted by pings
Captains feel there is no inherent benefit they are getting by joining zones . They are able to do their choice of order even after not being in the zone.
Self opt in is required to make the zones work - for this we need earning models coupled with improved zone understanding.
Verdict
Refining and scaling the Zones system could potentially boost business and driver satisfaction. It's a clear signal that we're onto something good, and it's worth investing more effort into producing this feature.
The Big Picture and the solution
Through brainstorming with marketplace PMs and driver feedback, we clarified the next steps for Work Zones. Our goal was to transform Work Zones from a localized tool into a core feature of Rapido, boosting efficiency and satisfaction for both captains and users.
Our roadmap focused on five key elements:
Automation: Moving to an in-app system for smoother management and reduce operations cost.
Hooked Method: Finding the right internal and external triggers
Data-Driven Decisions: Using robust reporting to guide improvements and strategies.
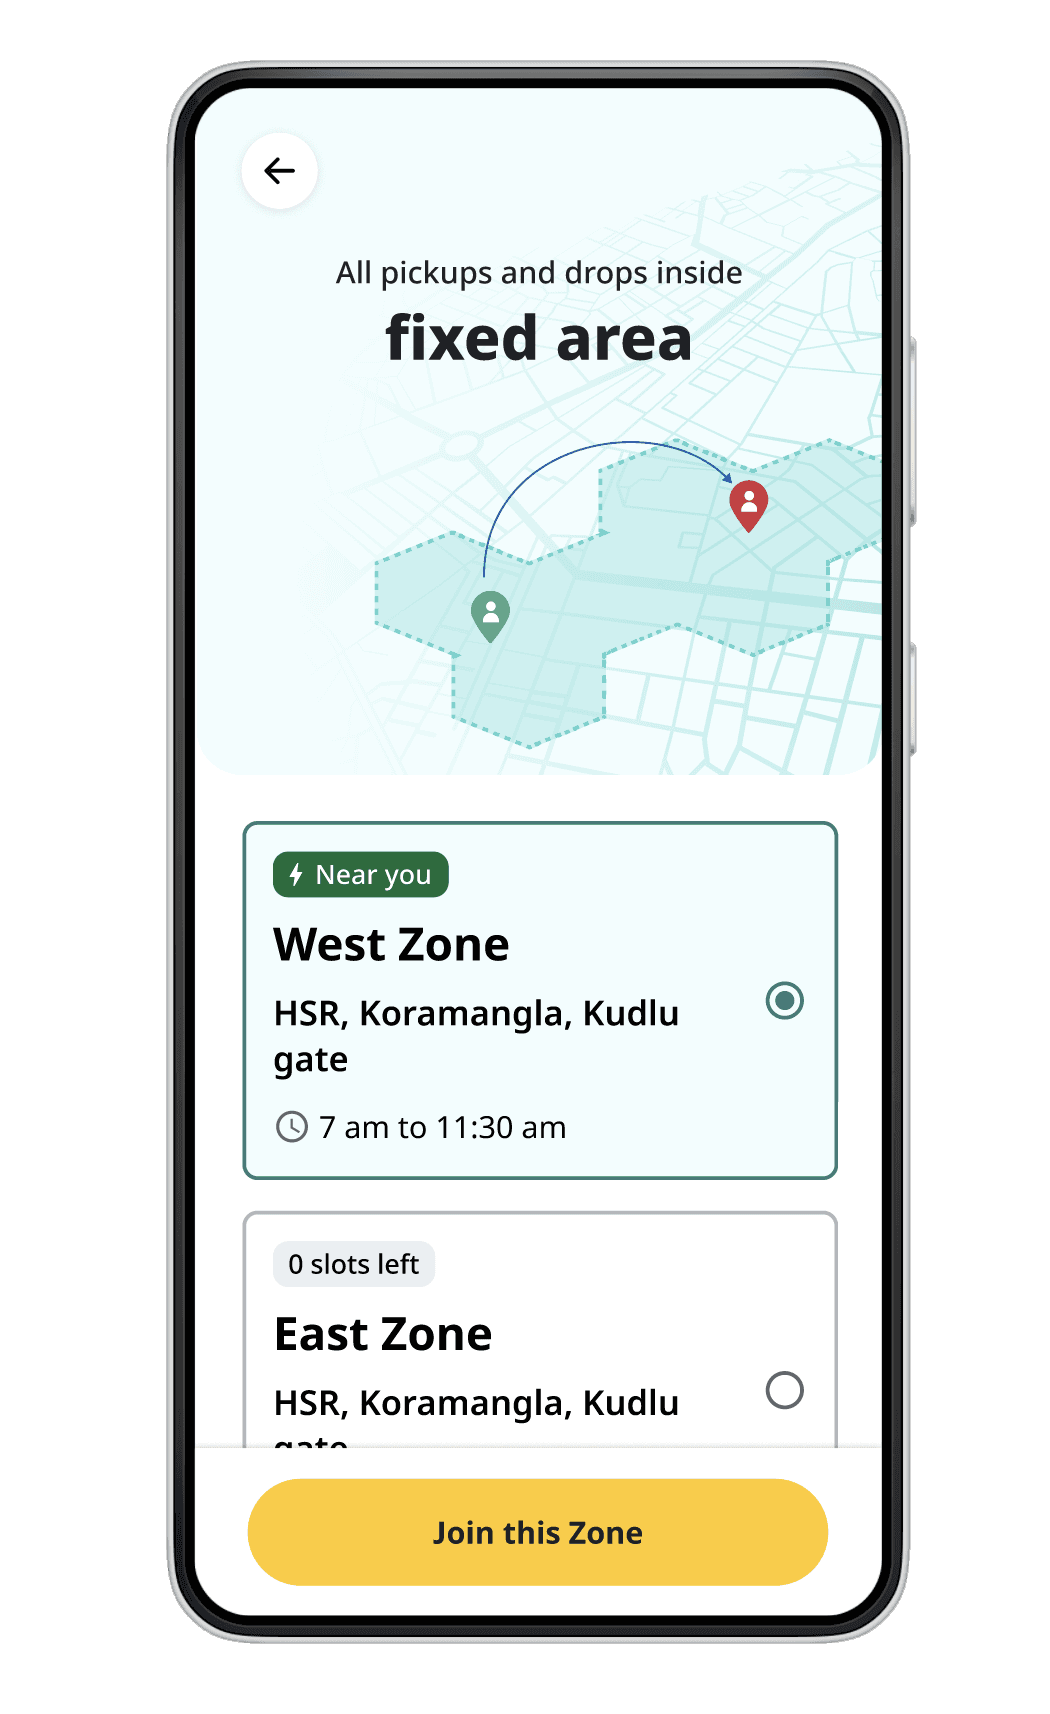
Captain Empowerment: Giving drivers more control and better earning opportunities.
Scalability: Designing for quick expansion and experimentation.
Adaptability: Ensuring the system remains flexible and responsive to changing business needs.
This vision wasn’t just about upgrading Work Zones; it was about enhancing Rapido’s operations and user experience for the future.
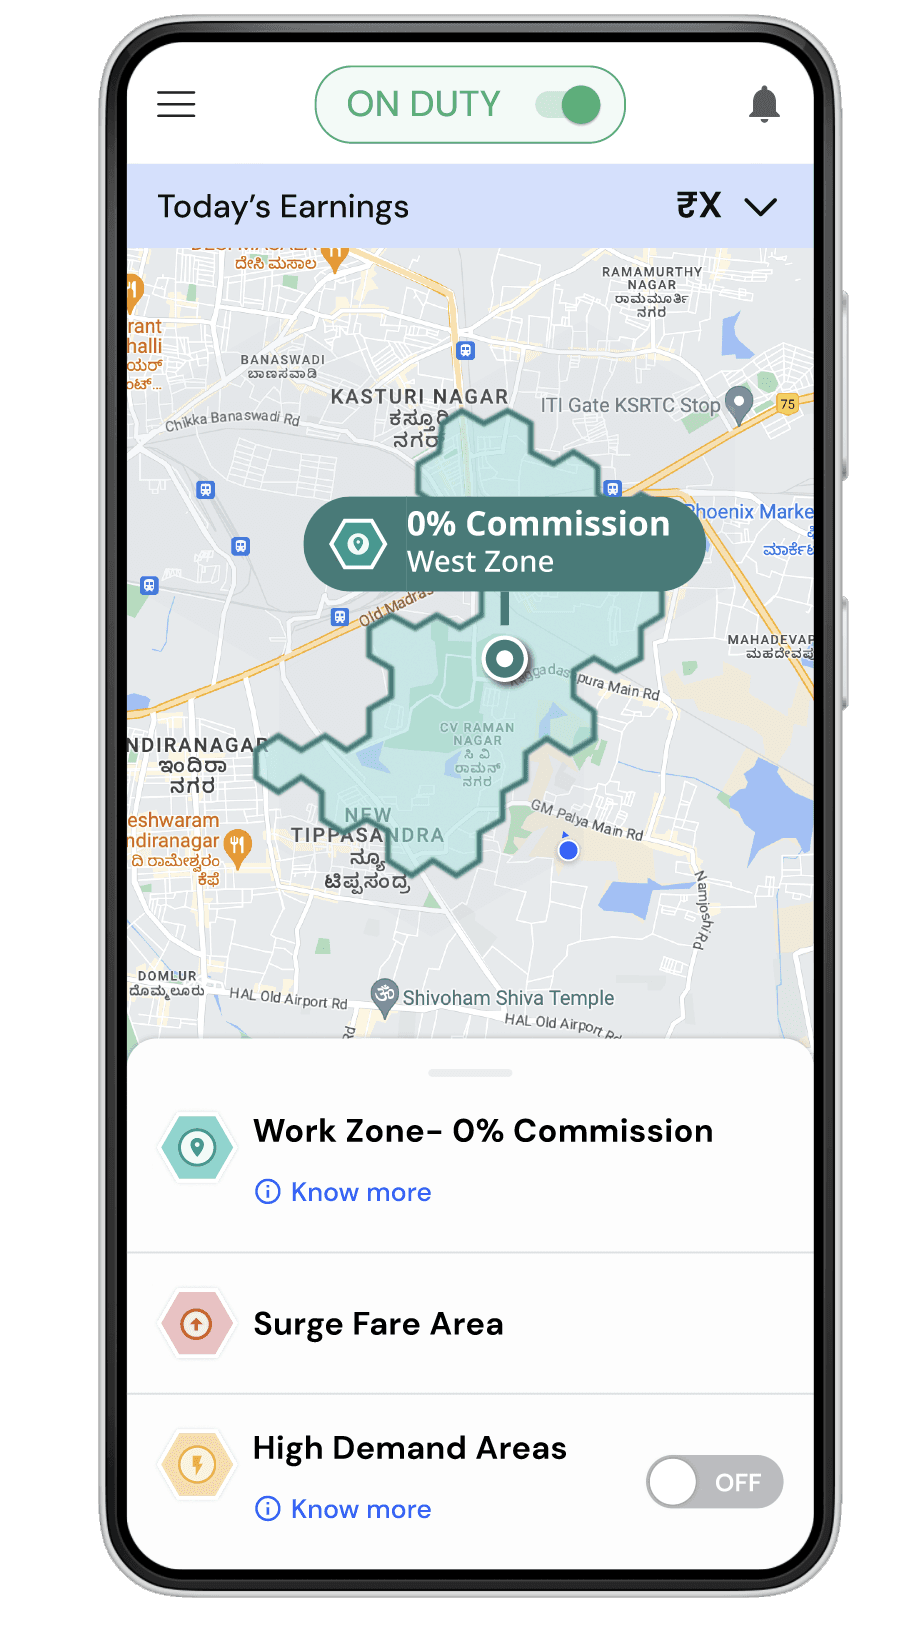
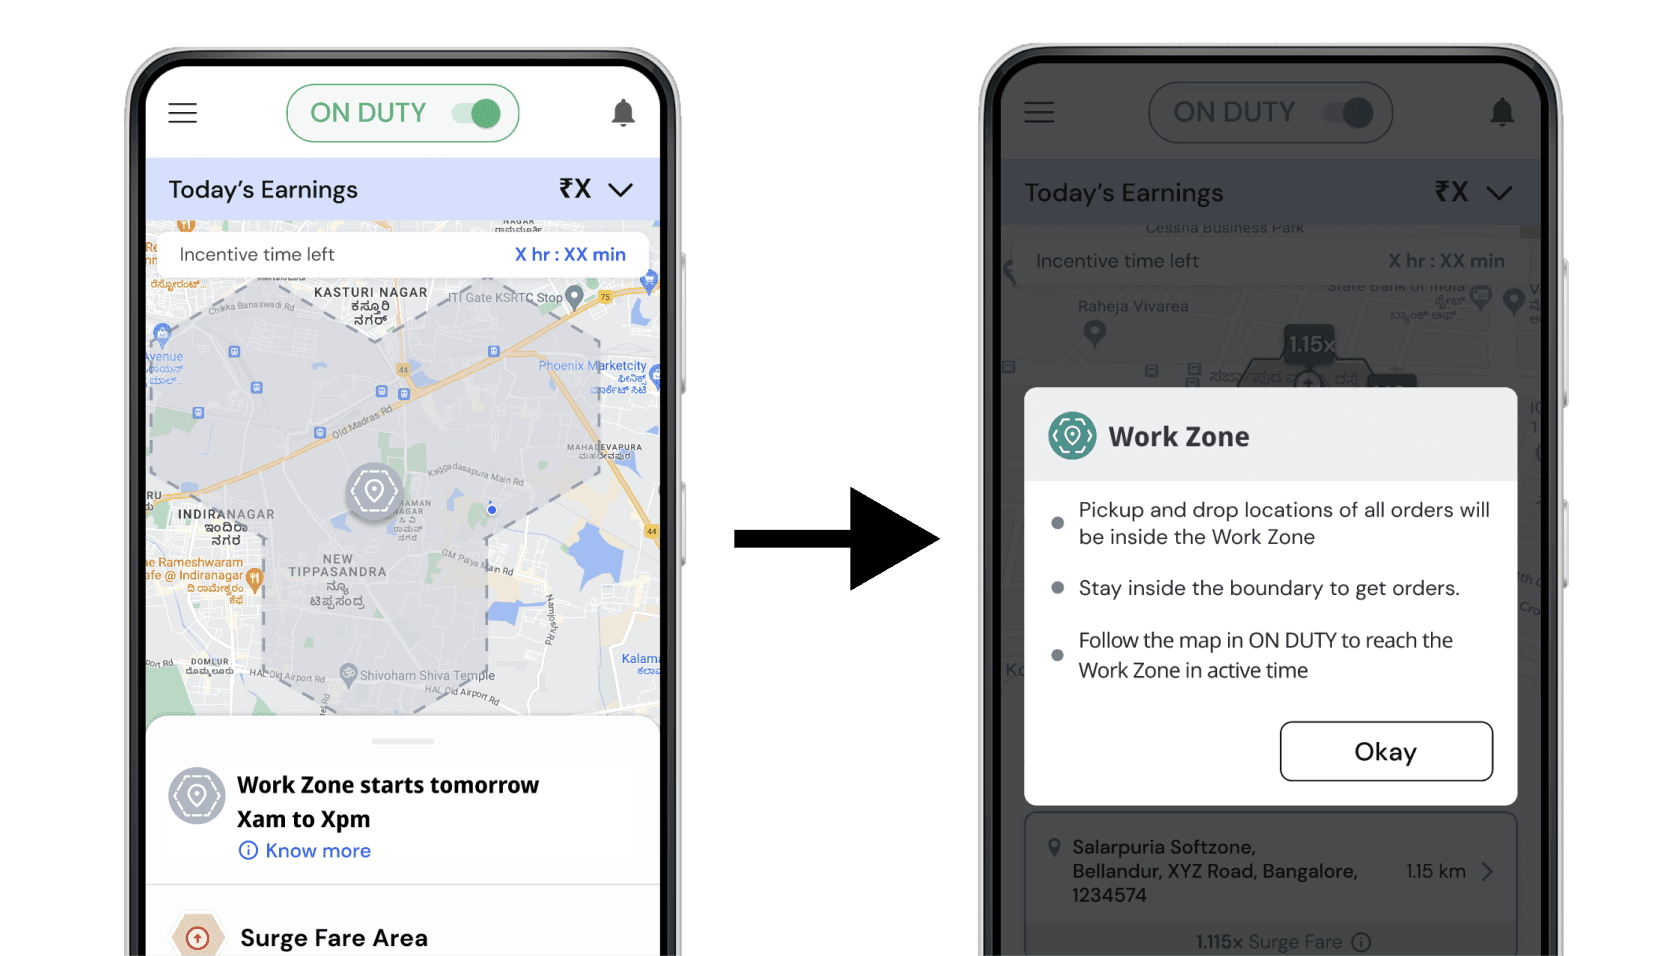
High Visibility of Value proposition
A quick overview about the zones
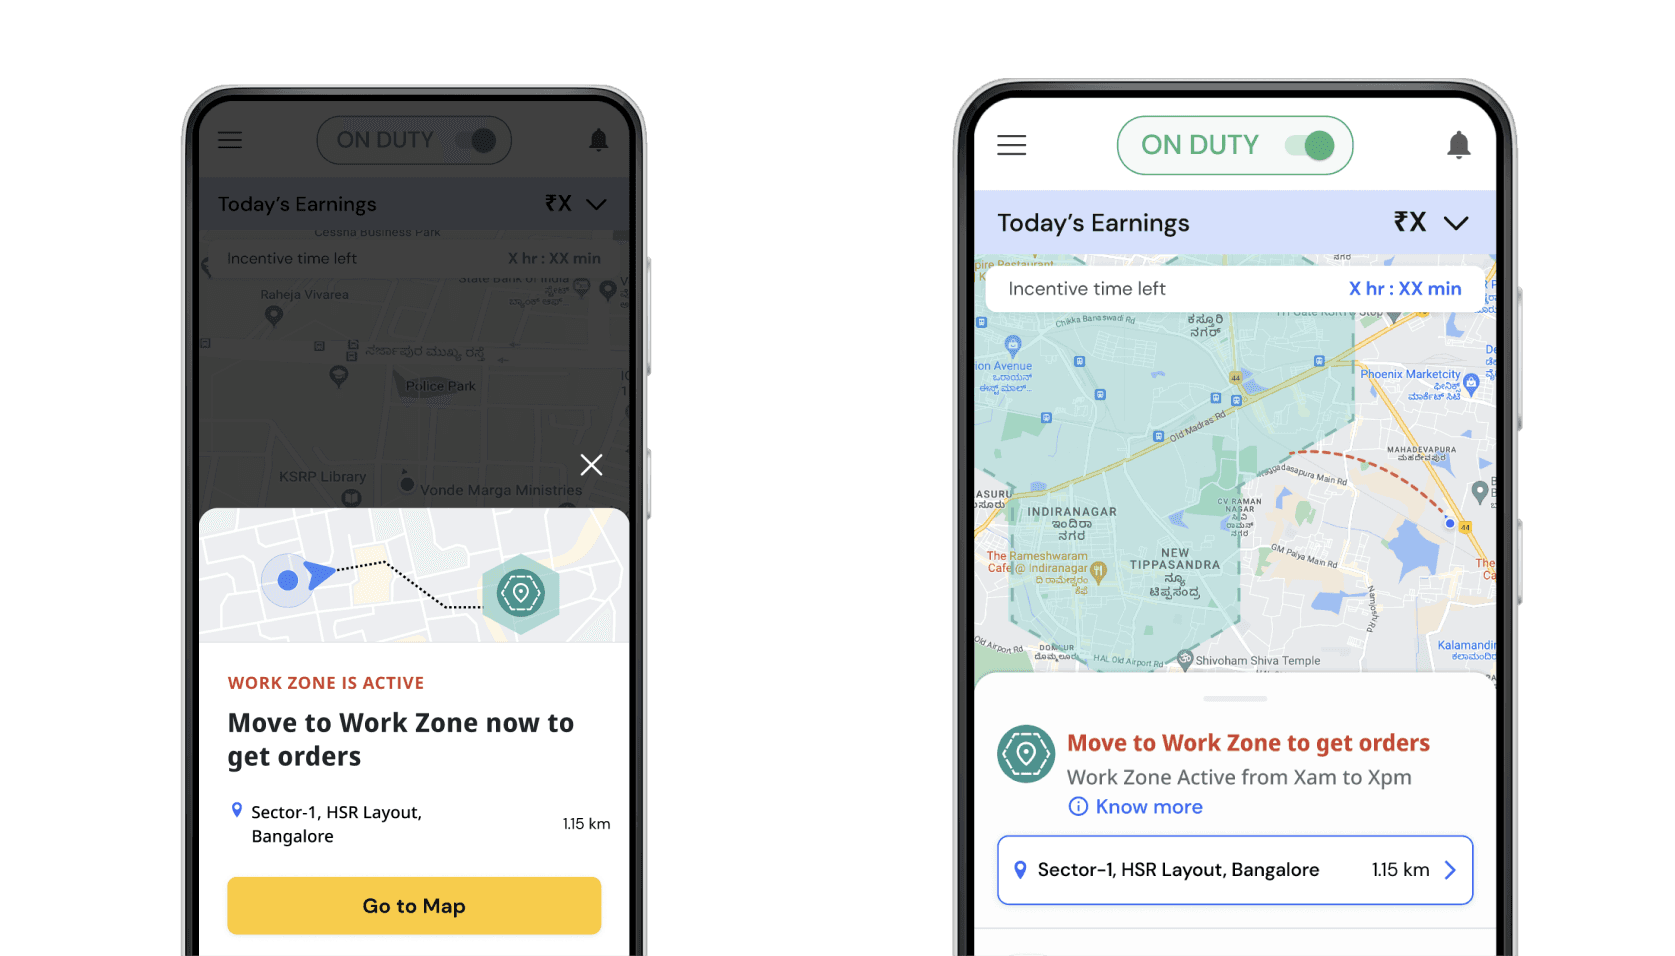
Real-time nudges

Full User Control

Alerts/ automation

Building trust
Data insights
Adoption Without Incentives: Delhi Work Zones showed strong adoption rates even without additional incentives, indicating that drivers value location affinity.
Sustained Behavior: After 15-20 days of working within a zone, drivers tended to stay consistent, continuing to operate within the zone without dropping off.
Impact of Real-Time Nudges: Over 50% of daily active captains joined zones through real-time nudges when entering a zone.
Significant Ride Contribution: Work Zones now account for approximately 1,000 Bike and Bike Lite rides daily—rides that were previously unattainable.
Challenges and Learnings
The Micro Corridors project brought unique challenges that turned into valuable learning opportunities:
User understanding: With the research team unavailable, I connected directly with drivers to uncover their challenges firsthand—a hands-on approach that felt like design detective work.
Cracking the System: By reaching out to regional managers, I unraveled how Micro Corridors operated and identified key issues, sharing these insights with the product team to complete the bigger picture.
Collaboration: As the sole designer, I juggled research, UI design, and testing while collaborating with teammates through constant discussions and updates on Slack.
Building Team Synergy: Working with a new team of developers and PMs was an exercise in trust and collaboration. Through regular meetings, we aligned our efforts and discovered fresh perspectives on the product.
Each challenge strengthened the project and made the journey rewarding!
Smooth Scroll
This will hide itself!
This will hide itself!